(Data) Visualisation
Data storytelling through visualization is crucial because it transforms complex things which are inaccessible or hardly accessible into something we can more easily grasp - something we can see.
By combining data with visuals, such as graphs, charts, and maps, we can 1) either effectively explore or 2) effectively communicate patterns, trends, and outliers that might otherwise go unnoticed. This approach not only makes data more accessible and understandable to a wider audience but also enhances decision-making by providing a compelling narrative that connects the data to real-world implications.
Inspirational videos
|
The best stats you've ever seen, Hans Rosling, https://www.youtube.com/watch?v=usdJgEwMinM)
|
Hans Rosling is, for many, a founder of "data storytelling" ...
|
|
The beauty of data visualization (David McCandless), 2012, https://www.youtube.com/watch?v=5Zg-C8AAIGg |
Data journalism, "Dataset should change your mindset" |
|
Turning Bad Charts into Compelling Data Stories, Dominic Bohan | TEDxYouth@Singapore, 2019, https://www.youtube.com/watch?v=edAf1jx1wh8 |
There are better and worse ways how to visualize ... |
|
The Evolution Of Data Visualization | Dustin Cabral | TEDxBryantU, 2023, https://www.youtube.com/watch?v=sOJet45-kcY
|
Everyday life can be transformed into data and visuals ... |
|
Data Design: a language that widens our world view, Valentina D'Efilippo, 2021, https://www.ted.com/talks/valentina_d_efilippo_data_design_un_linguaggio_per_ampliare_la_nostra_visione_del_mondo |
TED Talk, Introducing the concept of "design" into the thing |
Lectures
Basic principles of data visualization in academic practice (Tomáš Marek, KISK), 2021, https://medial.phil.muni.cz/Play/12136
- Visual representations of data are powerful tools of scholarly communication. However, extensive research shows that they are not always used with sufficient functionality. This lecture and follow-up workshop will focus on the basic principles and rules of data visualization and its application. The lesson will focus on data visualization foundations and concepts, such as data-ink ratio, chartjunk or memorability. We will dive shortly into relevant cognitive science topics, such as pre-attentive processing or memory.
-
Effective data visualisation comes in many shapes and sizes, but how do you move away from a standard bar chart?
Valentina D'Efilippo is a designer, illustrator, and creative director based in London.
- Longer but nice view from a "data designer". Very broad and complex introduction.
She is doing online master classes in the domain, https://www.valentinadefilippo.co.uk/
-
Are you an entrepreneur looking to share data with your investors, stakeholders, or consumers - but you don't know where to start? Visual presentation of information is a necessary skill in modern communication, even if you don't know the first thing about Photoshop. Join William Beutler and Jenny Karn, of digital agency Beutler Ink, to learn how you can use data to share powerful visual stories with any audience.
-
You will learn:
• The do's and don'ts of data visualization
• The importance of analysis alongside the numbers
• Choosing the right presentation for your data
• Tools that can help with - or without - a budget
Examples from the Internet
- Poppy field, (D'Effilipi), infographics about the human life costs of Wars, https://poppyfield.org/
- Meetomentum: Trending seeds, (D'Effilipi), Analysis of me too tweet trends, http://metoomentum.com/
- DISSINET Data Snapshots, a social-history project about medieval heresy, https://dissinet.cz/data-snapshots
Books
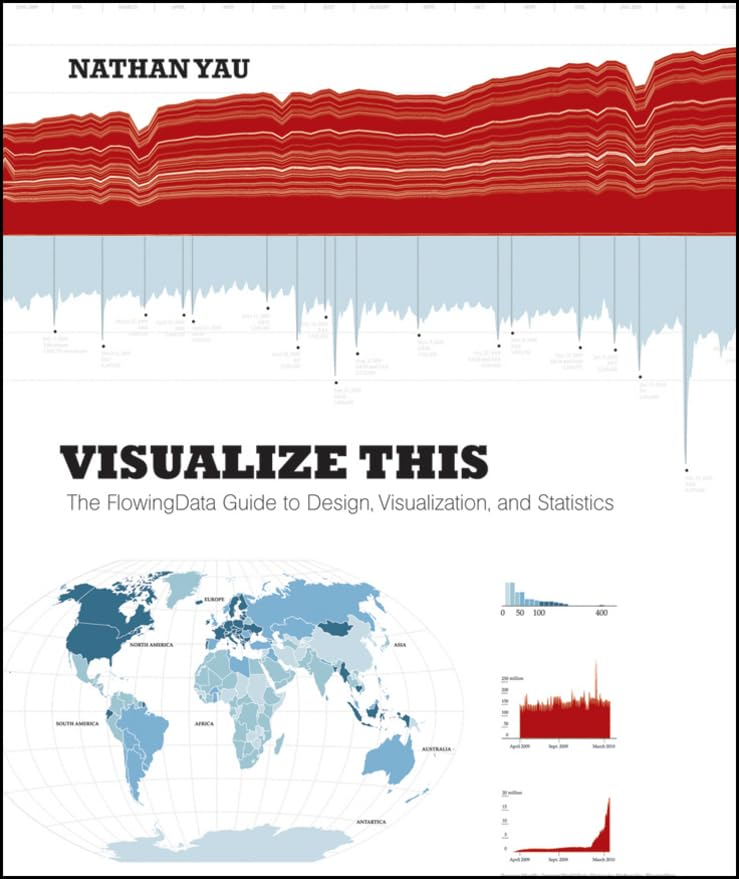
| Yau, N. (2024) Visualize This: the flowingdata guide to design, visualization, and statistics second edition. 2nd edn. Indianapolis: John Wiley and Sons. https://flowingdata.com/visualize-this/ |
|
|
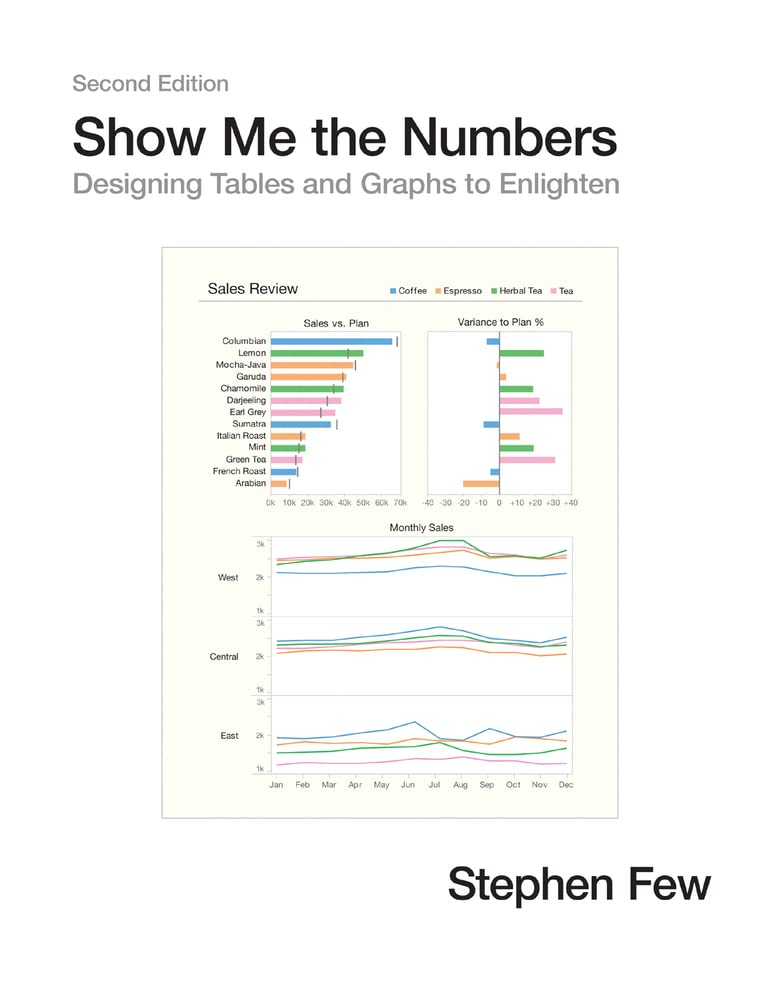
Few, S. (2012) Show Me the Numbers: Designing Tables and Graphs to Enlighten. Second edition. Burlingame, Calif: Analytics Press.
|
|
|
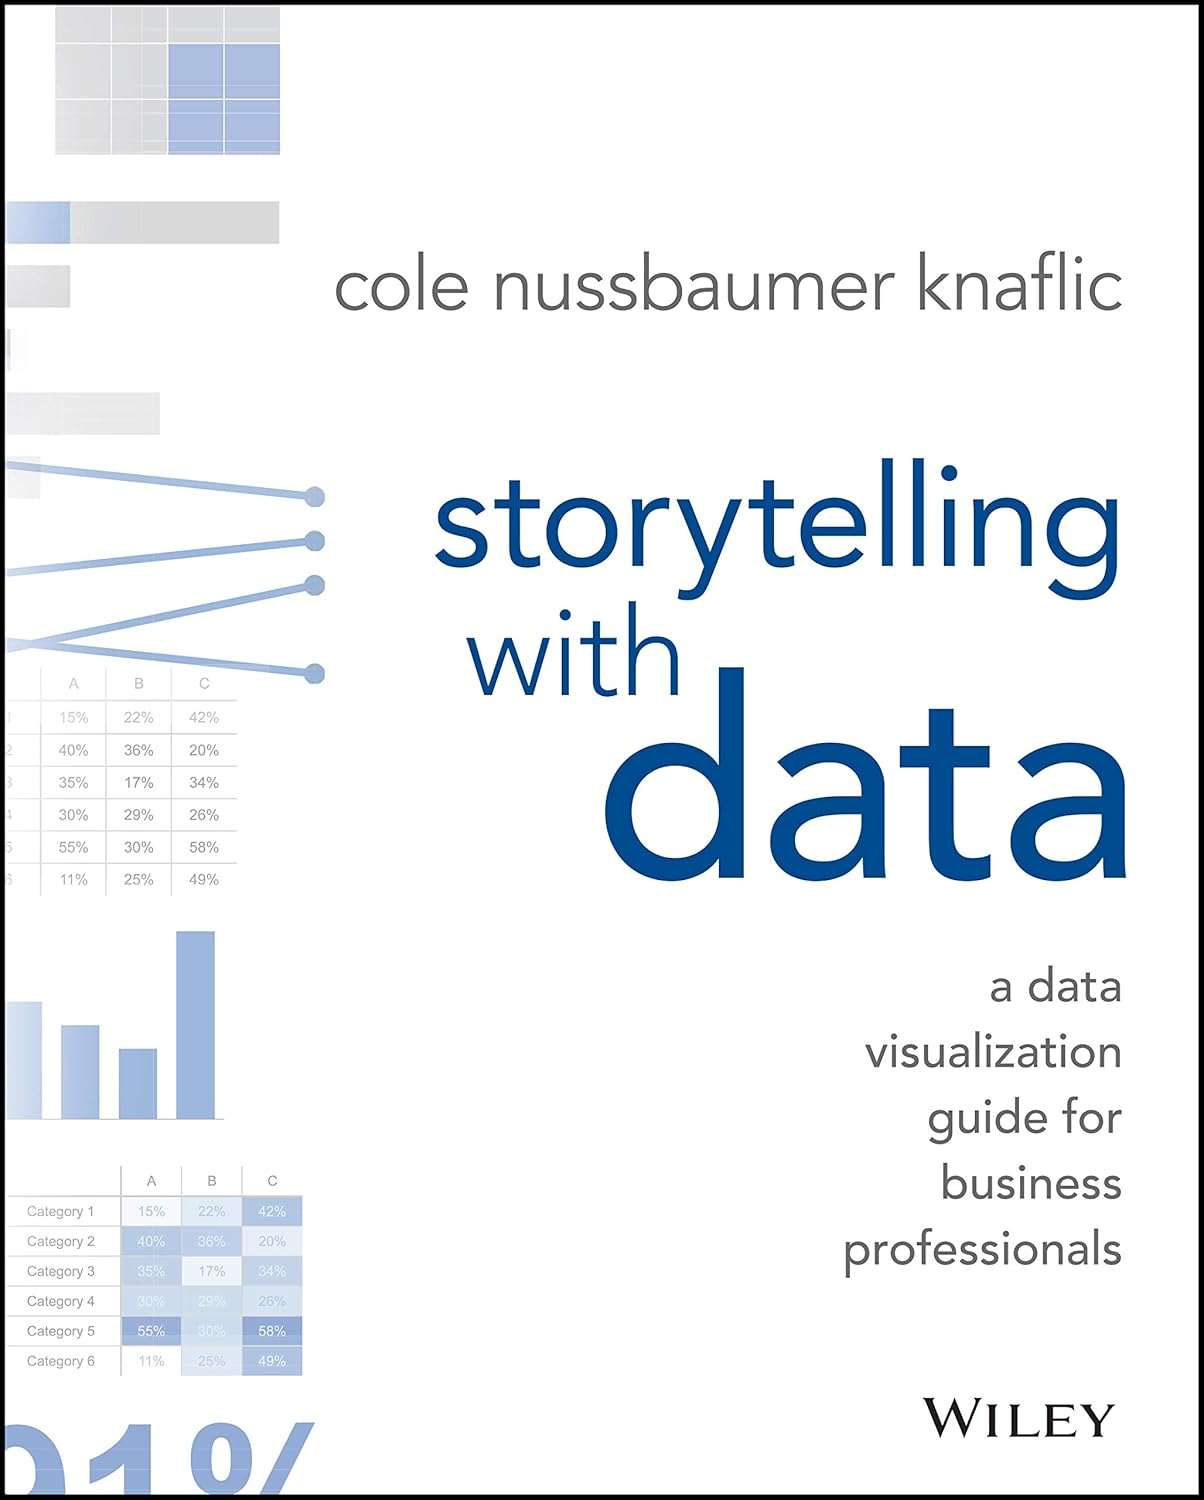
Knaflic, C.N. (2015) Storytelling with Data: A Data Visualization Guide for Business Professionals. 1st edition. Hoboken, New Jersey: Wiley.
|
|
|
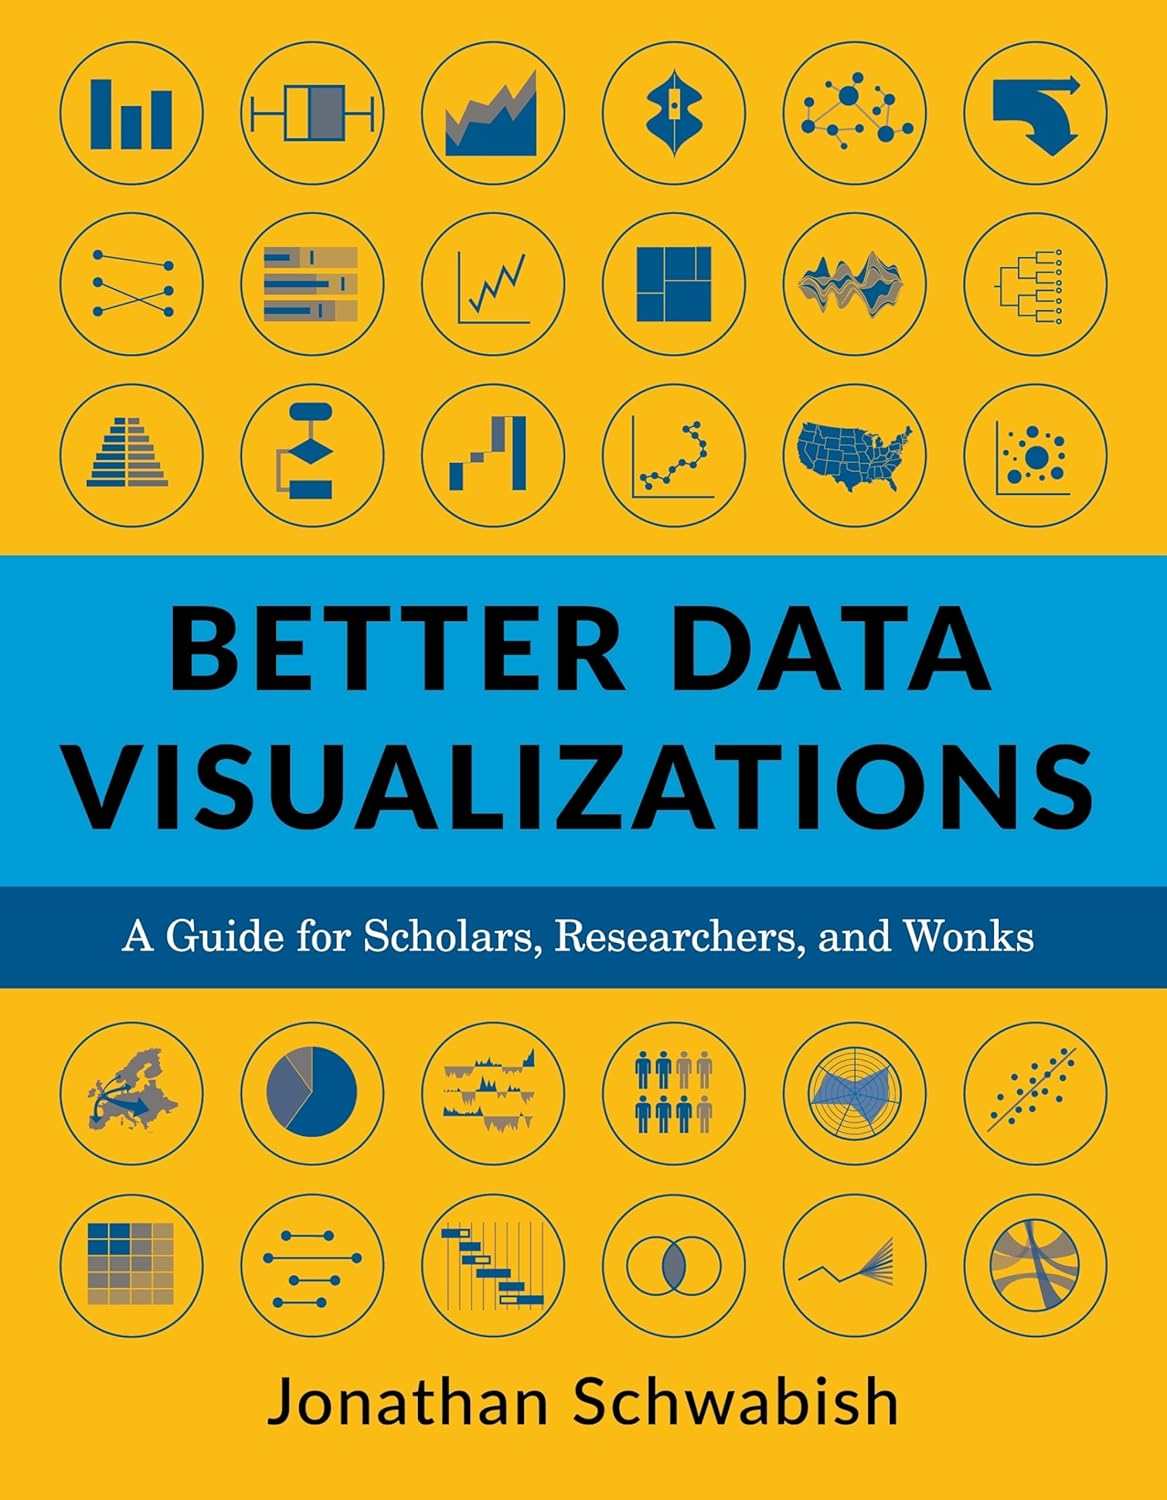
Schwabish, J. (2021) Better Data Visualizations: A Guide for Scholars, Researchers, and Wonks. New York: Columbia University Press.
|
|
Other resources
Online services
- https://www.datawrapper.de/ "Enrich your stories with charts, maps, and tables. "
Datová žurnalistika Českého Rozhlasu, https://www.irozhlas.cz/zpravy-tag/datova-zurnalistika
Datacamp